2021 was a tough year to be a Nebraska football fan. Nay, it’s been a rough half decade.
Let me hit you with some sad facts: We haven’t had even a winning season since 2016, let alone a season competitive for a conference title or (ha!) national championship. Our head coach, Scott Frost, started with much fanfare in 2018 – but he hasn’t secured more than 5 wins in a single season, ending 2021 with a cumulative 15-29 record as the Huskers’ head coach.
But at least this year, our dreadful 3-9 record doesn’t feel like the whole story. Every single one of our nine losses has been by single digits. We’re hanging in there no matter the opponent, never getting blown out. Six of our painful losses were to ranked teams – heartbreakers that came down to the final seconds.
“Nebraska is a better team than its record shows.” That’s not just what us delusional cornheads are saying. It’s been an oft-repeated talking point from sportscasters, sports podcasters, and journalists. And I gotta say, it feels so true. We felt competitive with the top teams in the country. I feel real hope that the pieces will come together by (fingers crossed) next season.
But how do we measure this sentiment? If we believe our Win-Loss record underestimates us, what are other ways to quantify the Big Red?
Quick disclaimer: the Tableau interactives render best on desktop. Sorry to my mobile dataheads!
To explore this question, I gathered data on every game played by the 64 teams who belong to a Power Five conference (ACC, Big 12, Big Ten, Pac 12, SEC), through Week 13 of the season. Most teams are done with the regular season by now, including (mercifully) the Huskers.
Let’s start with the basics: wins and losses. This graph shows all Power Five teams, sorted by most wins (go, Dawgs) to most losses (sorry, Wildcats). Since strength of schedule is relevant to Nebraska’s storyline, I also highlighted which of these games were against a ranked opponent.
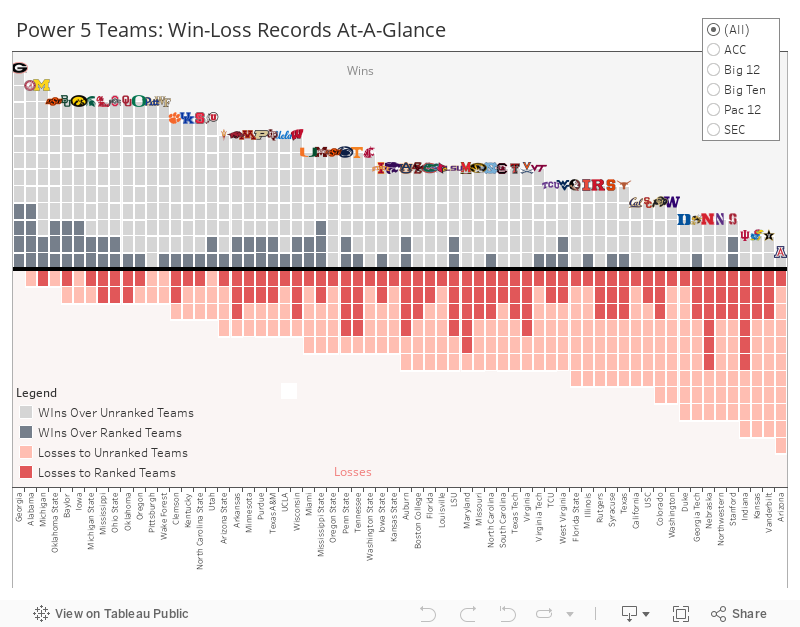
Right away, you can see that Nebraska is an outlier. SIX LOSSES TO RANKED TEAMS! If our opponents weren’t so strong, maybe we would have banked a few more W’s. What’s crazy is that 94% of Power Five teams didn’t even play against six ranked teams all season.
But this chart doesn’t capture just how close our losses were. In this version, I show number of losses (on the x-axis) plotted against the average loss margin (on the y-axis). Some super interesting trends:
- Teams that lose rarely, tend to lose in close games. Basically, if you’re a team on the bottom-left, you’re pretty good. You only had a couple of losses, which were super tight games. Think: Alabama, Oklahoma State, Michigan.
- Teams that lose often, tend to lose by a lot. If you’re a team on the top-right, you’re having a rough season. You had a lot of losses, and your losses tend to be by a lot. Think: Kansas, Duke, Arizona.
- Nebraska lives on its own in the bottom-right – lots of losses, all of which were close. Usually, teams that lose often get blown out. We managed to be uncommonly competitive in these losses.
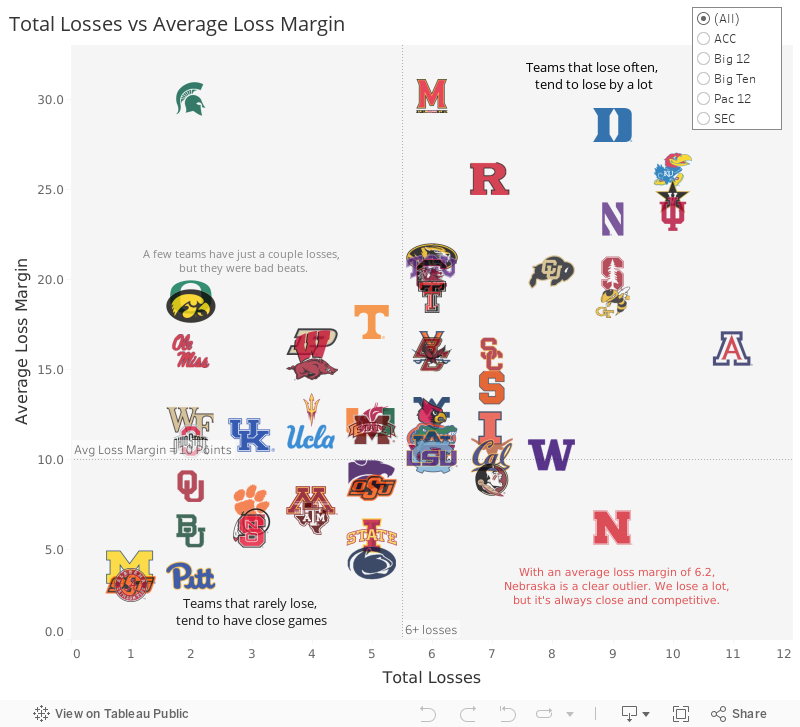
I think this visualizes why Nebraska doesn’t feel like a 9-loss team. The other 9-loss teams (Duke, Georgia Tech, Northwestern, Stanford) suffered an average loss margin of 22.75 points per loss. Nebraska ended the year with an average loss margin of just 6.22. It’s weird, it’s frustrating, it’s interesting.
In fact, if you plug in a trend line here, you’ll see a statistically significant correlation between losses and loss margin. This correlation says that good teams (few losses) lose by a little, bad teams (lots of losses) lose by a lot.
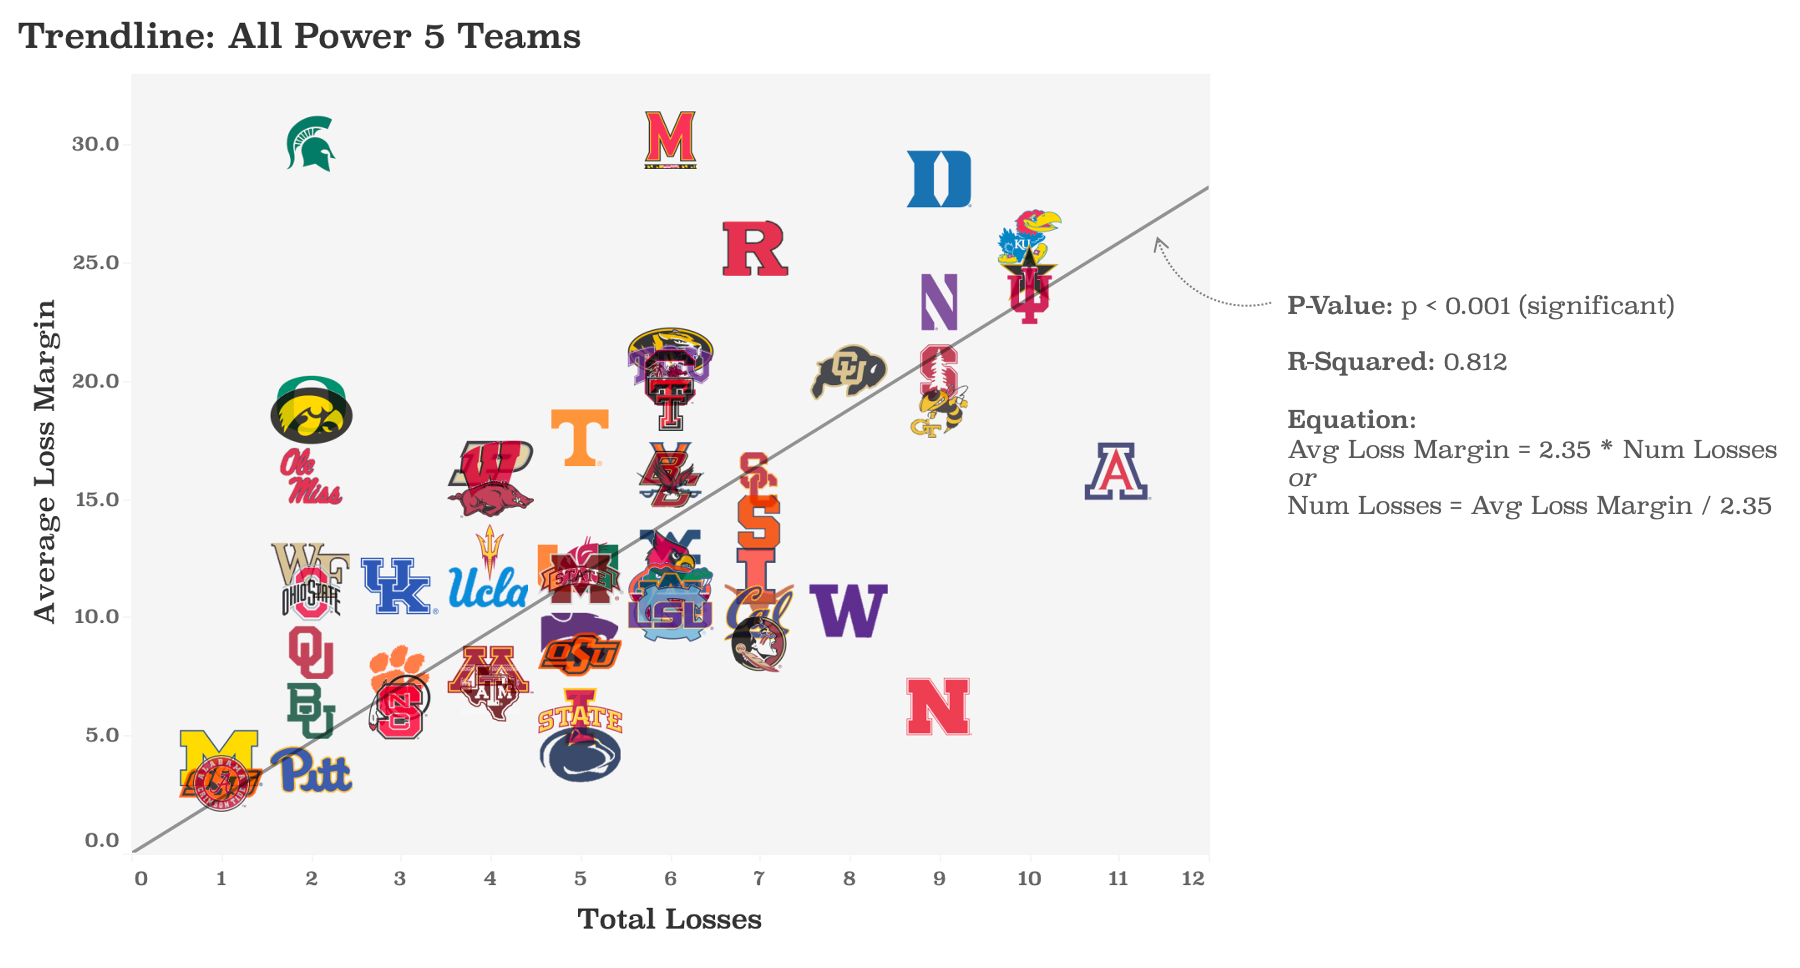
So let’s plug Nebraska into the regression formula. “Hey, trendline! If all we knew about Nebraska was that it had a 6.22-point loss margin, what would you predict Nebraska’s record was?” This super simple model predicts that the Huskers would have 2 or 3 losses. Nowhere near our astonishing 9 losses.
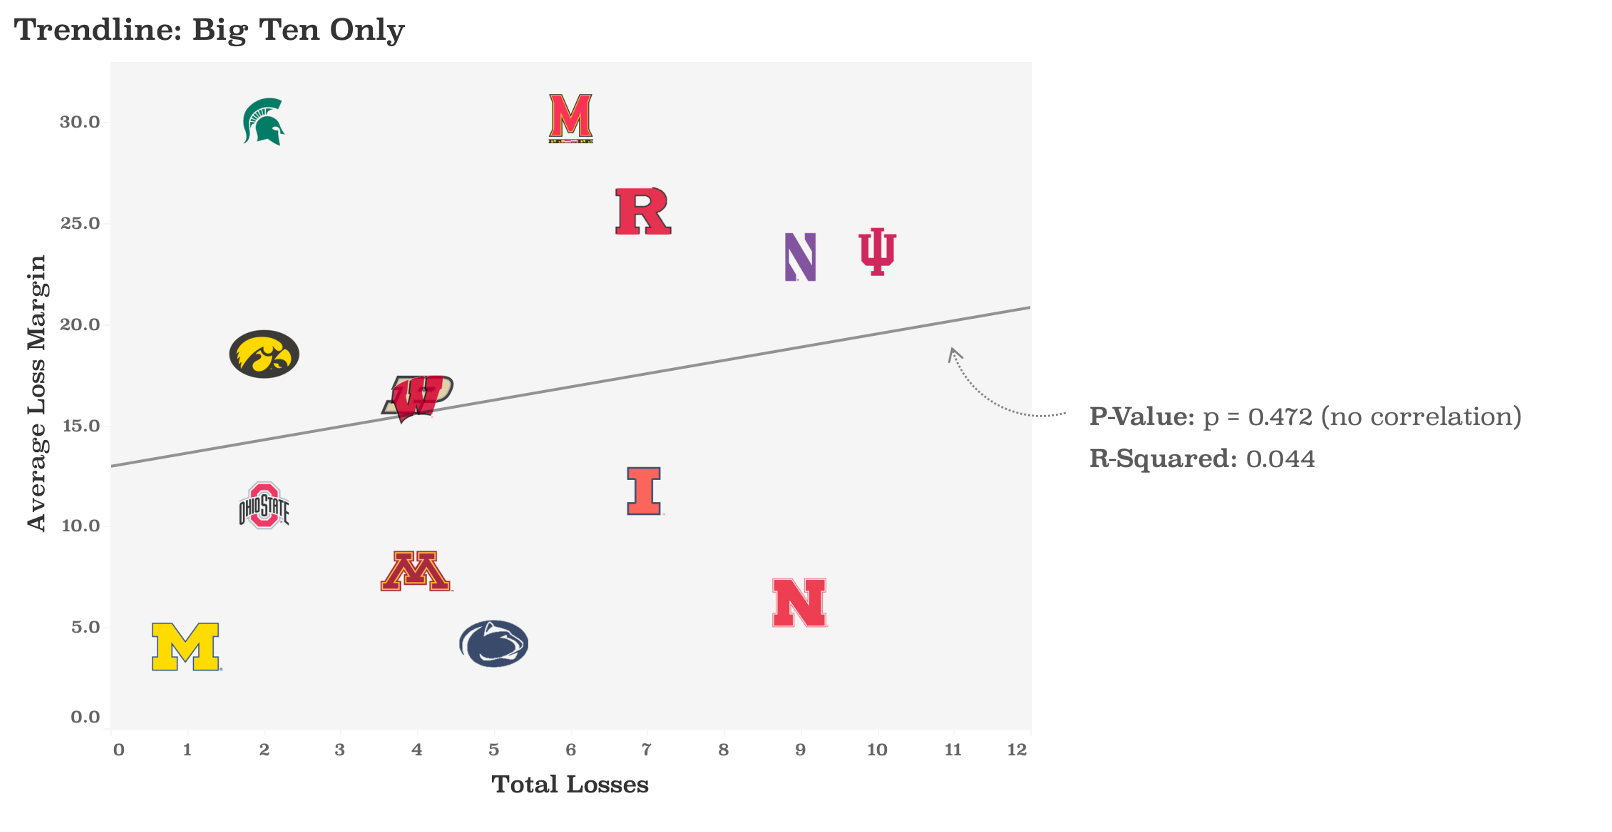
One potential factor: the Big Ten conference was super weird this year. Let me show you what I mean.
You can see, for most conferences, that the correlation above remains true. Good teams have close losses, bad teams get blown out. This is true and statistically significant for the ACC, the Big 12, and the SEC. The Pac 12 is a little thrown off by Oregon (who had a bad loss to Utah a couple weeks ago), but if you exclude them the trend is the expected, statistically significant correlation.
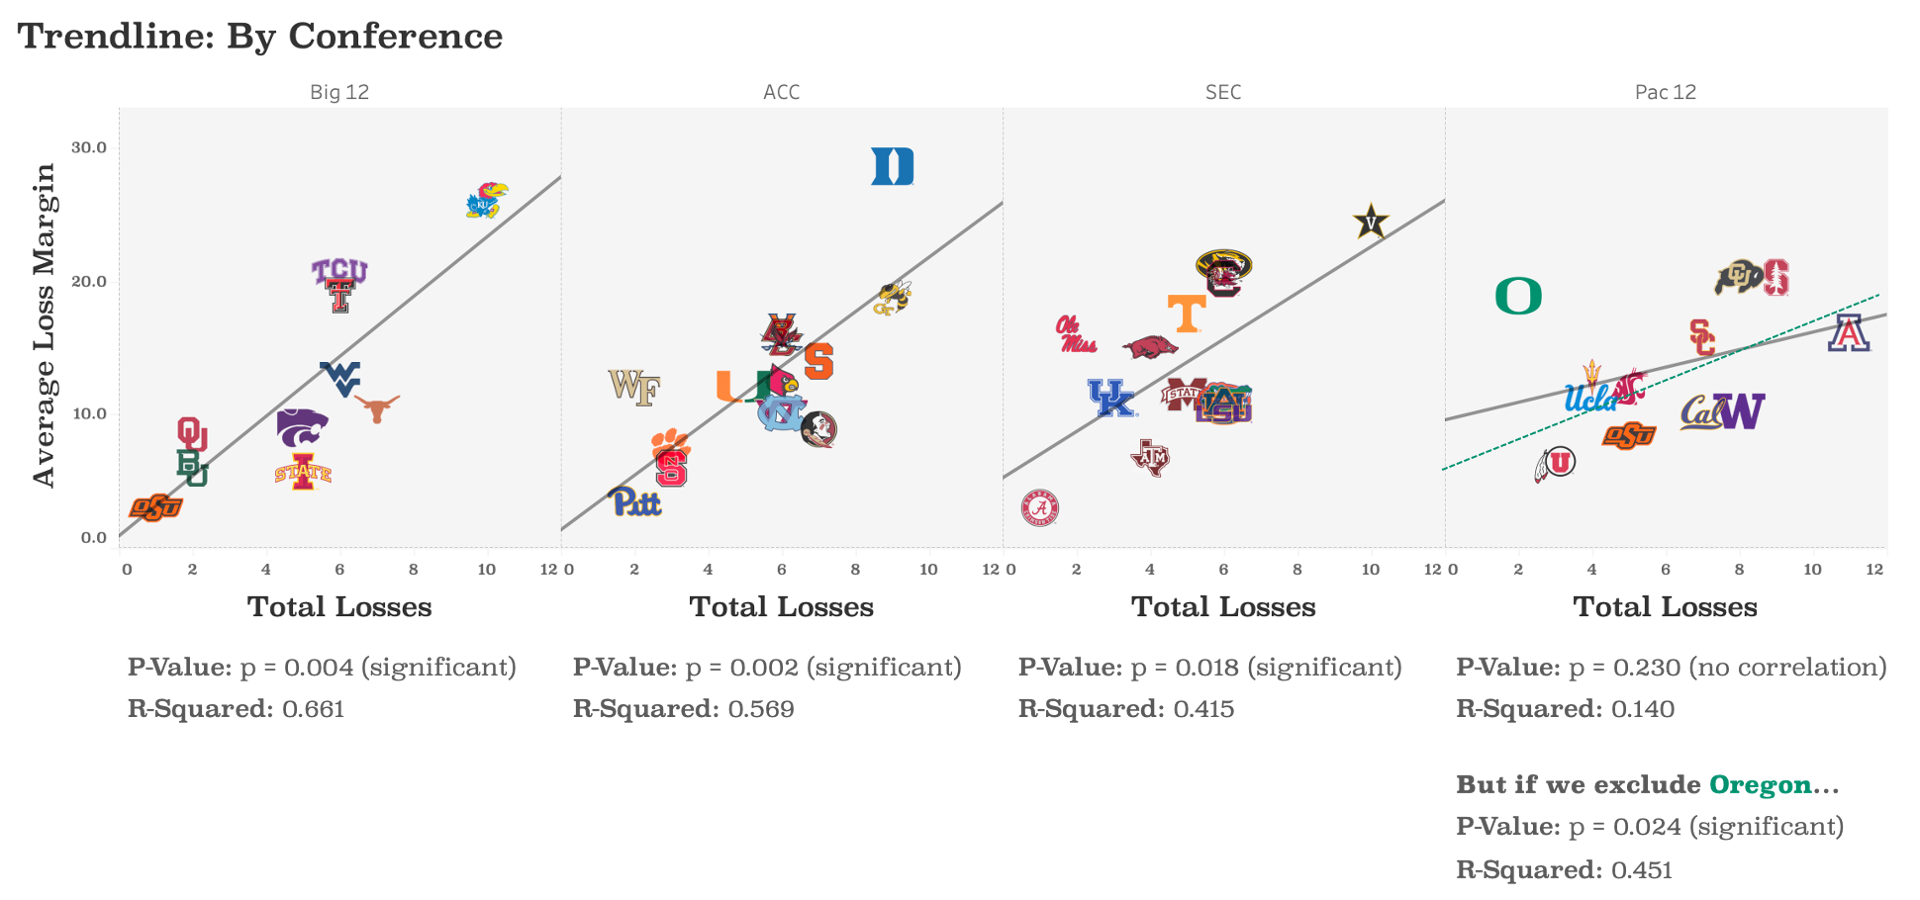
But the Big Ten? It’s all over the damn place. There is no trendline. Somehow everyone looks like an outlier.
Why is this happening? I could hypothesize forever – maybe the Big Ten has lots of strong coaches, maybe even our worst teams have decent programs, maybe players have been emotionally unpredictable as this season’s Great British Bake-Off unfolded. All I know is that the Big Ten is weird, and it’s one of the factors that drove Nebraska’s extremely weird season.
Does any of this matter? No, I know, the wins matter. And we didn’t get many of ‘em. But does it make me feel better? Like something positive came out of these past four months? Like Nebraska football isn’t a hopeless waste of a pastime?
Yes to all! This analysis will keep my denial alive and well during the long offseason.
Until next time, thanks for tuning in dataheads. Congrats to the teams who made it to the post-season, and happy holidays to all (even Ohio State fans).
Dd