I usually love College Football Bowl season. It’s a magical time at the end of the regular season where strange intra-conference match-ups happen, where talented athletes actually get to rest for a couple weeks so they really shine, and where sponsors insist on longer- and longer-named bowl titles (one of this year’s longest and most ridiculous: the Cheribundi Tart Cherry Boca Raton Bowl … it’s apparently a juice?). There is even a bowl that proclaims it has become sentient, with an amazing twitter account and Reddit presence; I applaud you and miss you, dear sweet Belk Bowl.
This year, however, was bittersweet. Nebraska’s losing record made us bowl-ineligible for only the third time in 48 years. (Whoa, I just realized that stat corresponds to our season record of 4-8; damn you, former head coach Mike Riley, have you been trolling us?). Most of us Husker fans entertained ourselves by bandwagoning onto our newly-hired head coach’s current team. But you know what else gave me holiday cheer?
Data visualizing, baby! This past week, I created my own dataset about each of the 40 bowl games that have occurred since December 16th; the only one left, by the way, is the Championship Game between Georgia and Alabama in two days. (GO DWAGS.)
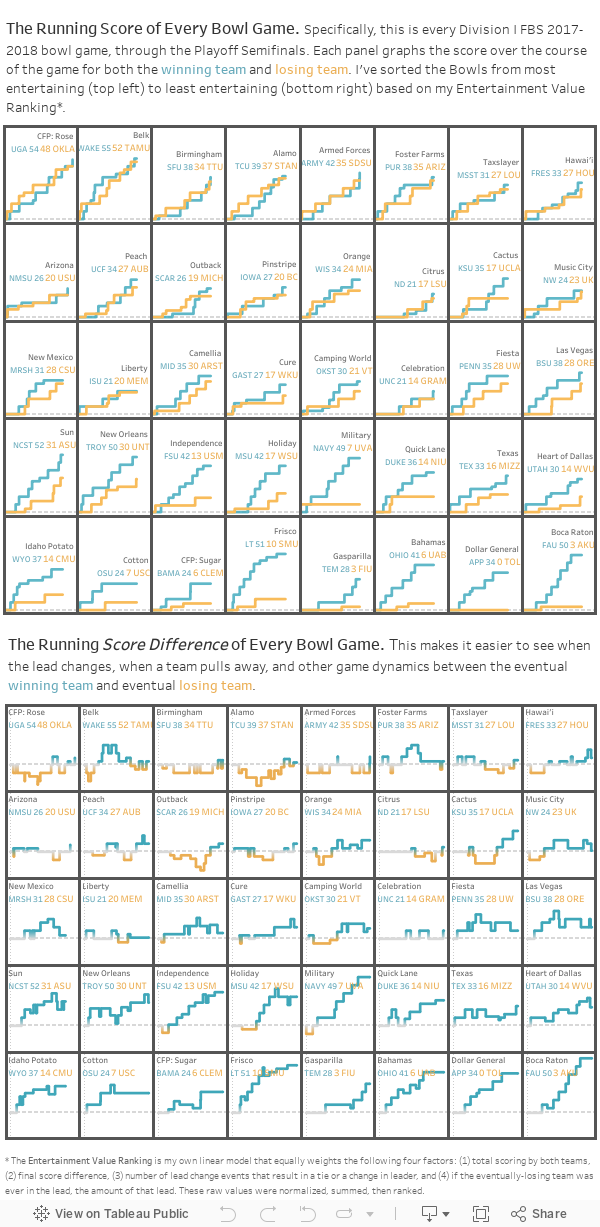
I wanted to represent every game in an easy-to-digest, one-page snapshot. As part of this, I thought it would help to sort the bowls so the “most entertaining” were first. Of course one cannot simply eyeball the games to make this determination. There’s no math (and, therefore, no fun) in that. So, I made a simple algorithm to calculate what I call the Entertainment Value Ranking. More on that later.
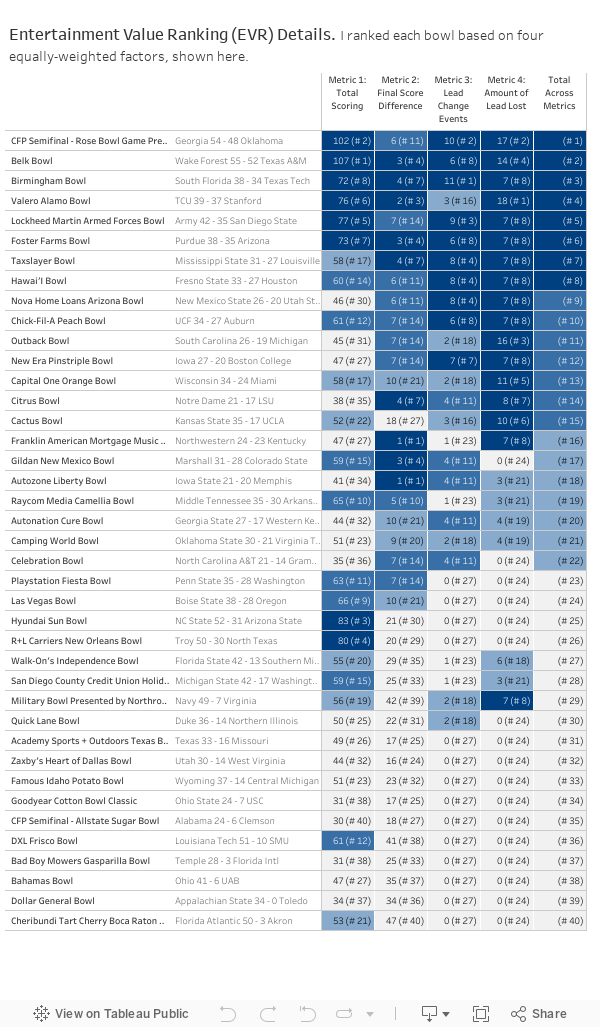
You dataheads out there are probably wondering what goes into the Entertainment Value Ranking (henceforth: EVR) that I calculated. I chose four metrics that I could calculate based on the scoring data I collected. The factors I included were:
- Total Scoring = Team 1 Final Score + Team 2 Final Score. All things being equal, I enjoy higher-scoring games more.
- Final Score Difference: Team 1 Final Score – Team 2 Final Score. The closer the final score, the more entertaining it is. This also helps to downweight games like Cheribundi Tart Cherry Boca Raton Bowl, where FAU laid down a solid 50 in a blowout against Akron (who only scored 3).
- Lead Change Events: Number of Times the Leader Status Changes. If one team is ahead, and the other team ties it up, that’s one event. If one team takes the lead from the other, that’s one event. I just counted these and summed ’em up.
- Lead Lost: If Losing Team Was Ever Ahead, Amount of That Lead. It’s fun to see a come-from-behind situation. So this helps upweight those games.
Because these are each on difference scales, I normalized each of the raw values (i.e., put them all into a 0 – 1 scale), added them up, then ranked those sums. And, based on the handful of games that I watched, I think it actually does a good job representing which games were competitive and fun to watch. The Rose Bowl, which was a double-overtime shootout, should of course be #1. I swear it’s just a happy coincidence that my sweetheart Belk Bowl came in at a solid #2. I was a little surprised to see the Peach Bowl come in at a low-seeming #10; adding in a Scott Frost “bump” was tempting, but ultimately seemed self-pandering.
In the spirit of transparency, here’s a table showing how each bowl’s EVR was derived:
Last, I need to give a shout-out to Tableau blogger Chris Demartini, whose viz on golf tournaments taught me how to create step lines, and inspired the “small multiples” chart layout. Awesome work, dude.
What do you think, dataheads? Any other factors you would incorporate into an EVR? Any thoughts on bowl game sentience? Comment away.
-Dd